Using Matplot in Zeppelin – Invalid Display Variable
Are you coming up against the dreaded issue:
“Invalid DISPLAY variable” when trying to use Apache Zeppelin with Matplot?
I have the solution for you. It’s a one liner that will fix you.
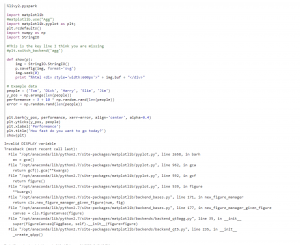
Zeppelin will happily display a matplot but you need to use code that looks like this.
%pyspark

import matplotlib.pyplot as plt; plt.rcdefaults()
import numpy as np
import matplotlib.pyplot as plt
import StringIO

plt.switch_backend('agg') # <-- Super important line that fixes the error "Invalid DISPLAY variable"
def show(p):
    img = StringIO.StringIO()
    p.savefig(img, format='svg')
    img.seek(0)
    print "%html <div style='width:600px'>" + img.buf + "</div>" # essentials creates html to be displayed.

# Example data
people = ('Tom', 'Dick', 'Harry', 'Slim', 'Jim')
y_pos = np.arange(len(people))
performance = 3 + 10 * np.random.rand(len(people))
error = np.random.rand(len(people))

plt.barh(y_pos, performance, xerr=error, align='center', alpha=0.4)
plt.yticks(y_pos, people)
plt.xlabel('Performance')
plt.title('How fast do you want to go today?')

show(plt)
(MOST of the above code is from https://gist.github.com/andershammar/9070e0f6916a0fbda7a5 but unfortunately they missed one line I call out above.)
I would remind people that paragraphs are “living” and once you have initialize variables they live on in the interpreter. This can lead to interesting magic. For instance you could add the “Super Important line” and then later remove it. This wouldn’t immediately ‘break the graph’. The value is still set in the interpreter. You wouldn’t see it break until you restarted the interpreter. This can lead to confusion and may be why the sample code I borrow is missing this line I feel is critical. Just something to be aware of.
© 2019 Fullview Design. All rights reserved. Privacy Policy.